INTRODUCTION
Hepcidin was introduced for the first time in 2000 by Krause et al.1 It is primarily called Liver Expressed Antimicrobial Peptide (LEAP-1), a 25 amino acids hormone. Its level is highly dependent on iron level in the blood, as well as hepatocytes’ function. Although pancreatic β-cells, adipocytes, macrophages, and renal tissues slightly contribute to its production, the liver is the major organ of its production.2,3
Hepcidin is categorized as the key regulator of iron homeostasis. Hepcidin production on the other hand is regulated by Human Homeostatic Iron Regulator Protein (HFE protein). Attachment of HFE to transferrin receptor 1 leading to hepcidin switching off which in turn facilitates iron absorption through the duodenum and iron accumulation in the liver. Conversely, as HFE protein does not bind transferrin receptor 1, hepcidin production is switched on.4
When the plasma iron level or stored iron is high, hepcidin production blocks iron absorption through the duodenum, and its level is suppressed as iron level falls.5 Hepcidin inhibits the iron passage through placenta; it also suppresses iron release from macrophages.6
Hepcidin antimicrobial peptide (HAMP) gene encodes for the production of hepcidin. Its transcriptional activity is induced in response to an increase of plasma iron level, which stimulates Bone Morphogenetic Protein 6 (BMP6). Binding of BMP6 molecules to their receptors on hepatocytes will signal SMAD cascade (homology to SMA: Small phenotype and MAD: Mother Against Decapentaplegic protein), which finally induces hepcidin-encoding HAMP mRNA transcription.7
Hepcidin production is not only stimulated by the increase of plasma iron level; it is also affected by the inflammatory or infection responses or both.8 Interleukin-6 activates Janus kinase (JAK) 1/2 kinases in the liver triggering Signal Transducer and Activator of Transcription 3 (STAT3) phosphorylation ending with the activation of HAMP mRNA and an increase in hepcidin production.7
Hepcidin downregulates Ferroportin (FPN1); consequently, iron transport through enterocytes is inhibited too. Hepcidin also negatively affects macrophage ability in the liver and spleen to transport iron from the damaged red blood cells, which represent a considerable source of plasma iron.9
HEPCIDIN AND PERIPHERAL INSULIN RESISTANCE
STAT3 signaling pathway has a well-defined impact on the peripheral insulin resistance in various body tissues including the liver and the skeletal muscles. Development of insulin resistance due to increase of proinflammatory Interleukin-6(IL-6) is thought to be mediated by STAT3 signaling.10
Insulin is a stimulator of STAT3 signaling pathway, which in turn enforces the hepcidin expression in the liver. Lack of insulin is associated with the inhibition of hepcidin synthesis mediated by STAT3, which in turn is associated with sudden increase of FPN in the intestine, resulting in a state of iron overload seen in diabetic patients.11
Accordingly; serum hepcidin may increase in some diabetic patients who keep pancreatic β-cells partially functional. This is attributed to glucose stimulation of insulin release from pancreatic β-cells leading to increase the release of extrahepatic hepcidin, precisely from pancreas.12 Nnodim et al. confirmed that hepcidin level is significantly increased in type 2 diabetic patients. The increase of hepcidin level was accompanied by a very significant increase of IL-6 compared to the control.13 This finding aligns with the earlier findings confirming the contribution of macrophages and T-lymphocytes in the production of pro-inflammatory cytokines, especially IL-6, which leads to an increase in peripheral insulin resistance and also generates hepcidin later.14
Controversy; other studies addressed a reciprocal effect between iron homeostasis with insulin resistance. Iron builds up in the liver and other tissues associated with an increase of insulin resistance. Peripheral insulin resistance, on the other hand, may increase iron stored in tissues.15 This finding aligns with findings of Bek et al. who concluded that hepcidin level decreases in progressed type 2 diabetic patients associated with a massive pancreatic cell damage, which would have an effect on diabetic-related iron overload and increase of peripheral insulin resistance.1 Pancreatic β-cells are highly sensitive to iron overload, i.e., low hepcidin level in diabetic patients with massive pancreatic failure is associated with increase of peripheral insulin resistance.16
EMPAGLIFLOZIN AND HEPCIDIN
Empagliflozin, a sodium-glucose transporter-2 inhibitor (SGLT2 inhibitor), is characterized by its ability to mitigate insulin resistance. This action could be responsible for Empagliflozin anti-inflammatory effects expressed in terms of the inhibition of highly sensitive C-reactive protein (CRP) levels and a decrease in the level of lipoprotein remnants.17
The anti-inflammatory action of Empagliflozin may play a role in the significant reduction of pro-inflammatory mediators, including CRP, IL-6, and tumor necrosis factor-alpha (TNF-a), in addition to lowering the level of uric acid. On the other hand, Empagliflozin was found to increase the levels of antioxidants like nitrite, β- carotene, and vitamins E and C.18
Based on the above discussion, the anti-inflammatory action of SGLT2 inhibitors in reducing inflammation in adipose tissues may explain the significant reduction of hepcidin level, demonstrated in several studies where patients were on SGLT2 inhibitors, leading to an increase in iron level in the blood as well as enhancing the production of red blood cells.19–21
When the levels of hepcidin mRNA expression and serum hepcidin concentrations increased, lower red blood cell counts, hemoglobin (HGB), and hematocrit (HCT) were detected. The treatment of hepatocytes with IL-6 induced both hepcidin mRNA expression and hepcidin secretion.22
Accordingly, data about the relationship between hepcidin level and type 2 diabetes mellitus (T2DM) seems to be inconclusive yet. More studies are needed to understand how hepcidin affected the diabetic patients.
OBJECTIVES
-
Determining how the induction of T2DM affects hepcidin level in albino wister rats.
-
Assessing the effect of Empagliflozin on hepcidin comparing to control groups.
METHODS
The study is interventional, randomized, and open-labelled. It was conducted in the animal house of the College of Pharmacy, Karbala University, Iraq, in association with the Department of Physiology, College of Medicine, Al-Nahrain University, Iraq. Thirty-six albino wister rats, aged 8–10 weeks, weighing 150 g and greater were randomized into three groups, 12 rats per each group. Group A was classified as the negative control group, where no intervention was conducted throughout the study. The rats in Groups B and C underwent T2DM induction through intake of High-Fat Diet/High-Sugar Diet (HFD/HSD) for 8 weeks. Ghee and olive oil at a ratio of 3:1 were fed to each rat in Groups B and C at a rate of 3 mL/kg/day for 8 consecutive weeks. A 25% sucrose water solution was also given to the rats routinely through the feeding bottle throughout the period of diabetes induction. This diet was stopped at the end of the 8th week, and all groups were fed normal rat diet and water till the end of the study (till the end of the 10th week).
Empagliflozin at a rate of 35 mg/kg/day was given only to the rats in Group C for 2 weeks beyond the induction of T2DM (after the 8th week).
A cutoff blood sugar value of 111.6 mg/dl glucose level was used, above which the rats were considered diabetic.
Out of 36 rats, two rats died during intracardial needle insertion (one from Group A, the other one from Group C, both at baseline). Three rats failed to develop T2DM (two from Group B, the third one from Group C with fasting blood glucose level of 104, 99, 101 mg/dL, respectively. A rat from Group A was eliminated to have 30 rats distributed equally in each group.
Blood glucose level was routinely measured using Blood Glucose Monitor strips manufactured by Roche Diagnostics. Blood samples for blood glucose level were obtained from the tail. Blood samples for hepcidin test were obtained via intracardiac technique under general anesthesia. Blood samples were then centrifuged at 3000 round per minute for 20 minutes to obtain serum. The hepcidin level of the three groups was measured at three different intervals; baseline, 8 weeks later (when T2DM induced), and at the end of the 2-week treatment with Empagliflozin (Jardiance®) of Boehringer Ingelheim.
The hepcidin level was measured using enzyme-linked immunosorbent assay (ELISA) technique using Rat Hepcidin (HEPC) ELISA Kit from Shanghai YL Biotech Co. Ltd.
STATISTICAL METHOD
Mean and standard deviation were used as descriptive statistics to outline the demographic data. For performing of hepcidin intragroup comparison t-test, two paired samples for means were used. On the other hand, ANOVA single factor was the analytic tool used to conduct weight and blood glucose level intergroup comparisons. Probability value less than 0.05 was considered statistically significant.
RESULTS
There was no significant difference in baseline rats’ weight in the three study groups [180.9 ± 11.97 g (Group A), 187.5 ± 13.1 g (Group B), and 190.8 ± 18.28 g (Group C)]; p-value was 0.324. Likewise, for the baseline level of fasting blood glucose [89.5 ± 5.1 mg/dl (Group A), 88 ± 6.5 mg/dl (Group B), and 88.9 ± 6.01 mg/dl (Group C)], p-value was 0.850 (Table 1).
TABLE 1. Baseline weight and blood glucose level in the three groups of the study.
| Variable | Group | No. | Mean ± SD | P |
|---|---|---|---|---|
| Baseline weight (g) | A | 10 | 180.9 ± 11.97 | 0.324 |
| B | 10 | 187.5 ± 13.1 | ||
| C | 10 | 190.8 ± 18.28 | ||
| Baseline blood glucose level (mg/dl) | A | 10 | 89.5 ± 5.1 | 0.850 |
| B | 10 | 88.0 ± 6.5 | ||
| C | 10 | 88.9 ± 6.01 |
Clinical manifestations of diabetes were recorded in Groups B and C even before week 8. Excessive urination was reported through monitoring of wetting of the straw in the cages; it needed to be replaced every other day rather than every 5 days. Excessive fluid intake was also reported through the need to refill the feeding bottles daily rather than every other day on average.
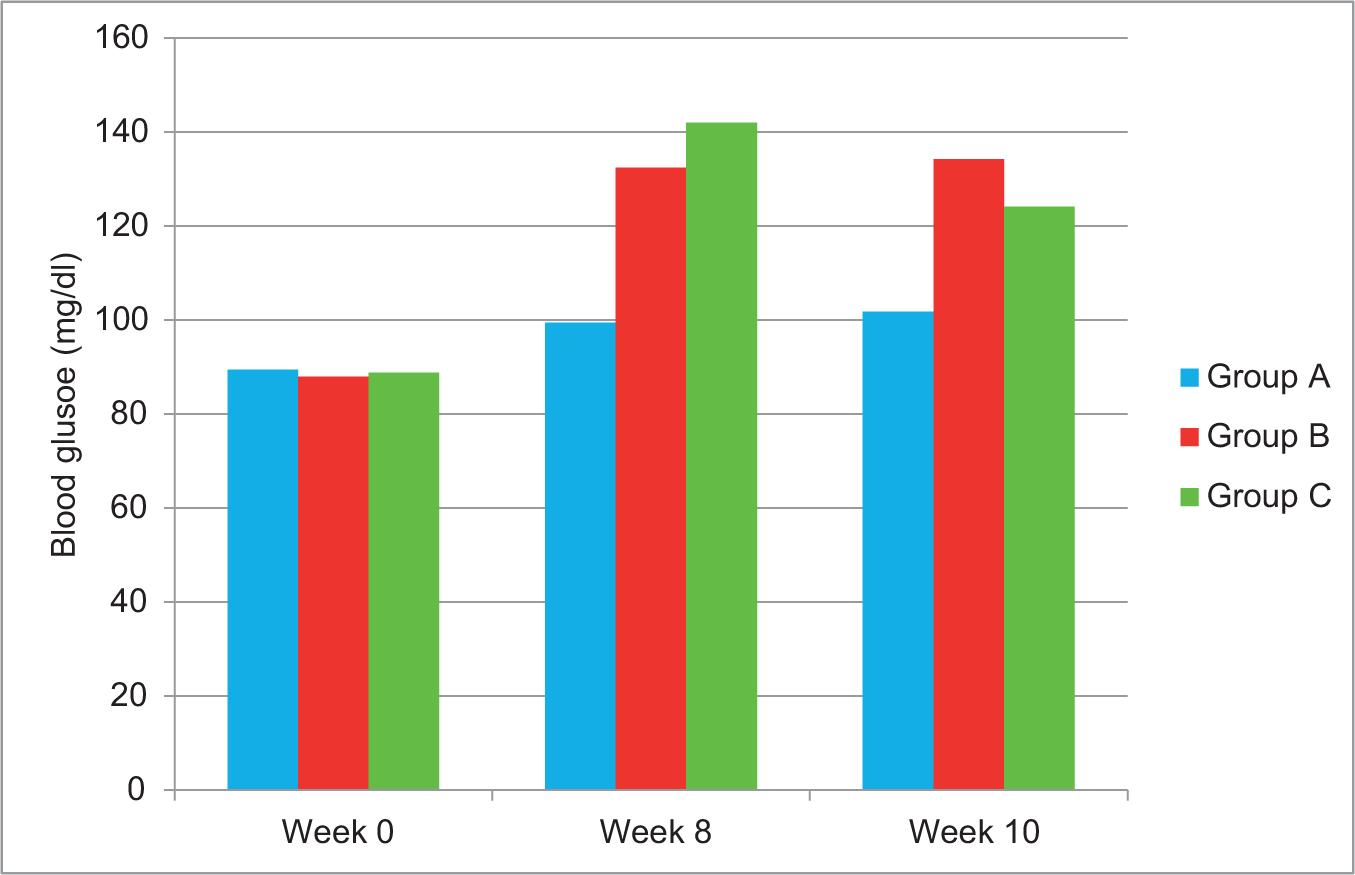
At week 8, induction of T2DM succeeded as fasting blood glucose level was significantly higher than baseline level and beyond normal range in Group B and Group C (132.5 ± 7.92 mg/dl and 134.3 ± 7.33 mg/dl, respectively), (p-value of <0.001 in both groups), while in Group A, blood glucose level also was significantly higher than baseline level but still within the normal range of 99.5 ± 6.24 mg/dl (p-value of 0.002) (Table 2).
TABLE 2. Comparison of blood glucose at two intervals (0 vs 8th) and (8th vs 10th) weeks within each study group by paired t-test.
| Group | Week 0 N = 10 |
Week 8 N = 10 |
Week 10 N = 10 |
P (0 vs 8th) |
P (8th vs 10th) |
|---|---|---|---|---|---|
| A | 89.5 ± 5.1 | 99.5 ± 6.24 | 101.8 ± 6.27 | 0.002 | 0.334 |
| B | 88.0 ± 6.5 | 132.5 ± 7.92 | 134.3 ± 7.33 | <0.001 | 0.001 |
| C | 88.9 ± 6.01 | 142.0 ± 13.58 | 124.2 ± 19.63 | <0.001 | 0.042 |
At week 10, blood glucose level was significantly decreased in Group C in comparison with week 8 (p-value of 0.042), while in Group B, blood glucose level was significantly increased than week 8 (p-value of 0.001). Moreover, no significant difference was noticed between 8th and 10th week regarding blood glucose level in Group A (p-value of 0.334) (Figure 1).
FIG 1. Blood glucose level in baseline (0 week), 8th week, and 10th week in three study groups.
The recorded baseline hepcidin levels for Groups A, B, and C were 87.23 ± 13.51, 86.24 ± 9.66, and 84.37 ± 7.91 ng/mL, respectively.
After the 8th week, hepcidin level in Group B increased significantly from 86.24 ± 9.66 up to 132.46 ± 51.96 ng/mL (p-value of 0.009). Also in Group C, hepcidin level increased significantly from 84.37 ± 7.91 to 135.39 ± 39 ng/mL (p-value of 0.001).
Hepcidin level dropped down insignificantly to 107.64 ± 17.19 ng/mL in Group B at the end of 10th week (p-value of 0.064). Contrastingly, there was a significant drop of hepcidin level (89.68 ± 11.59 ng/mL) in the rats of Group C (p-value of 0.001) (Table 3).
TABLE 3. Comparison of hepcidin at 2-week intervals within each study group by paired t-test.
| Group | Week 0 N = 10 Mean±SD |
Week 8 N = 10 Mean±SD |
Week 10 N = 10 Mean±SD |
P (0 vs 8th) |
P (8th vs 10th) |
|---|---|---|---|---|---|
| A | 87.23 ± 13.51 | 85.76 ± 18.17 | 0.782 | ||
| B | 86.24 ± 9.66 | 132.46 ± 51.96 | 107.64 ± 17.19 | 0.009 | 0.064 |
| C | 84.37 ± 7.91 | 135.39 ± 39.0 | 89.68 ± 11.59 | 0.001 | 0.001 |
Yet, in Group A, the hepcidin level at the end of the experiment was 85.75 ± 18.17 ng/mL with insignificant difference compared to baseline (p = 0.781) (Figure 2).
FIG 2. Hepcidin level in baseline (0 week), 8th week, and 10th week in the three study groups.

DISCUSSION
T2DM induction was successfully done after 8th week of using a combination of HFD/HSD, which was preferred to be used in this study rather than using Streptozotocin. As such, this type of combination ensures induction of inflammatory process and increases peripheral insulin resistance with minimum destruction of pancreatic β-cells.23 Although Streptozotocin is considered as a potent inducer of T2DM, its mechanism of action is via the destruction of functional pancreatic cells, which will affect insulin secretion, which in turn affects hepcidin level that depends on peripheral insulin resistance rather than decrease in insulin secretion.24–26
Hepcidin, a hormone that inhibits the absorption of iron from the intestine, may show increased levels in T2DM patients due to the increase of insulin secretion stimulated by the high level of blood glucose.27 In addition, high hepcidin level may have resulted from the stimulation of the extrahepatic pathway, specifically from macrophages, as a result of inflammatory process induction. Interestingly, Bekri et al. concluded that in massive obesity, the feedback control mechanism affects hepcidin expression in the liver but not in the adipose tissues, resulting in marked increase of hepcidin associated with obesity.28 This finding aligns with the findings of this study, which found a significant increase of hepcidin level after the T2DM induction. Hepcidin elevation can be attributed to the activation of STAT3 signaling pathway through high insulin level in response to hyperglycemia, and increase of the pro-inflammatory mediators may justify these physiological changes.11 Verga Falzacappa et al. and Pietrangelo et al. confirmed that STAT3 protein is a leading cause of activation of HAMP mRNA and inducing hepcidin release.29,30
In contrast to our findings, hepcidin level was found to be reduced in T2DM patients in several studies.31,32 In both these studies, the patients were classified as grade I obesity which associates with lower visceral fats, lower peripheral insulin resistance, and lower releasing of inflammatory mediators like IL-6 and TNF-α.33 However, excessive use of fatty diets, like in our experiment, justifies the increase of hepcidin level as a result of increased release of inflammatory mediators from the massively acquired adipose tissues.
In the positive control arm, there was an insignificant reduction of hepcidin level 2 weeks after stopping HFD/HSD, which may be attributed to the decrease of peripheral insulin resistance and the decreased demand on pancreatic β-cells to produce insulin.
Empagliflozin succeeded in reducing hepcidin level almost back to the baseline level, probably due to the anti-inflammatory effects of SGLT2 inhibitors and its ability to block STAT1-3 and JAK2 signaling pathways,34 in addition to the discontinuation of HFD/HSD. In addition, one of the actions of Empagliflozin is increasing Erythroferrone, which is a hormone that inhibits hepcidin production, and this may be contributed to the decrease in the level of hepcidin.35,36
CONCLUSION
Hepcidin levels significantly increased after the successful induction of T2DM. Empagliflozin has a significant role in the reduction of blood glucose and hepcidin.
RECOMMENDATIONS
We strongly recommend to further study the impact of Empagliflozin on inflammatory mediators, and its relationship with hepcidin level in newly induced T2DM, as part of building up a framework that demonstrates the multifactorial effect of Empagliflozin on peripheral insulin resistance.
STATEMENT OF ETHICS
The study was reviewed and approved by the Institutional Review Board of College of Medicine, Al-Nahrain University, Iraq (Decision No. 20211056, 2021 December 5).