Introduction
The first case of new coronavirus 2019 (COVID-19) was reported in China at the end of December 20191 and the disease was spread rapidly throughout the world. More than 200 countries were affected and the World Health Organization (WHO) has declared the COVID-19 infection as a pandemic.2
In COVID-19 conditions, each government reacts at different levels to control the number of new cases and deaths. Oxford COVID-19 Government Response Tracker (OxCGRT) tries to measure the governments’ responses against COVID-19 with a systematic methodology. Yan et al.3 indicated that governments’ responses to COVID-19 display significant differences and heterogeneity. Therefore, it is too difficult to compare national responses systematically.
Yan et al.3 examined four countries (Sweden, China, France, and Japan) and they emphasized that the countries’ responses are different from each other. According to their study, it is impossible to propose a one-size-fits-all strategy because of the countries’ different conditions (institutions structures, cultural differences, etc.). For this purpose, however, Hale et al.4 collected the data to constitute 18 indicators of government response. Stringency Index4 is a composite measure based on nine responses of all indicators. Eight of them are closures and containment (C) criteria and the last one is about health measurement (H). According to these indicators, this index is rescaled to create a score between 0 and 100 by the OxCGRT. The highest value shows the strictest response of a country.
Mathematical modeling can be a useful tool to estimate the number of infections or deaths due to a disease. There were also some attempts on both mathematical modeling and predicting or forecasting the COVID-19 cases (see for example Fanelli and Piazza5). However, to the best of authors’ knowledge, there are no modeling studies on showing the relation between the number of cases and stringency. Therefore, the objectives of this study were to (i) describe the COVID-19 cases of Emerging 7 (E7) countries by using suitable models, (ii) perform near-future forecast for these models, (iii) examine the causalities between the Stringency Index’s indicators and total cases in E7 countries, and (iv) propose some policies to control total cases in E7 countries.
Methods
Data set
As of July 25, 2020, COVID-19 infection data of E7 countries were obtained from the web page (https://github.com/owid/covid-19-data/tree/master/public/data). In addition to the number of total cases in E7, we use the Stringency Index’s indicators in these countries in our causality analysis. The data were garnered from the website (https://raw.githubusercontent.com/OxCGRT/covidpolicytracker/master/data/OXCGRT_latest.csv). These web pages are updated daily.
The indicators that take place in the Stringecy Index are shown in Table 1.
TABLE 1. Indicators of the Stringency Index.
| Indicator name | Indicator code |
|---|---|
| School closing | C1 |
| Workplace closing | C2 |
| Cancel public events | C3 |
| Restrictions on gatherings | C4 |
| Close public transport | C5 |
| Stay at home requirements | C6 |
| Restrictions on internal movement | C7 |
| International travel controls | C8 |
| Public information campaigns | H1 |
Source: Oxford COVID-19 Government Response Tracker (2020).
The first parameter of the Stringency Index, school closing (C1) is a kind of variable that measures the closings of schools and universities. This indicator uses the values that are between zero and three. No measurement counts with zero whereas three points mean that all schools must be closed. One point shows recommendations for closing schools, two points demonstrate the requirement for closing some of the schools.
The workplace closing (C2) is the second closure and containment criteria in the Stringency Index that measures between zero and three, as well. The definitions of the scores are very similar to C1, for instance, one point shows the recommendation of closing businesses. However, three points mean that only essential workplaces (hospitals, groceries, bakeries, etc.) can be opened.
C3 defines as cancel public events and it is classified as zero, one, and two points. Two points indicate that all public events will be canceled. Indeed, restrictions on gatherings (C4) is a complementary indicator with C3. It consists of five different levels from zero to four. In the scope of the parameter, zero means no restrictions for private gatherings. When the levels rise, restrictions will increase in gatherings. Three points state that from 11 to 100 people can gather. Whereas, it is not possible to throng more than 10 people.
Closing schools and workplaces supported in some countries with restrictions on public transport and lockdowns. These are the parameters of the Stringency Index as C5 and C6, respectively. One point in C5 means that it recommends closure or reduction of the volume of transportation in the cities. However, two points prohibit most citizens. C6 has four different dimensions. Except for zero, other dimensions call some kind of lockdown. Three points indicate that people have to stay in their homes without minimum exceptions.
C7 and C8 are internal and international travel restrictions, respectively. C7 is called restrictions on internal movement and it has three dimensions. The highest dimension (two points) means that there is an internal movement restriction somewhere. International travel controls (C8) have five different levels. The highest point (four points) indicates a ban on all vehicles in all regions or total border closure.
In the Stringency Index, there is only one health indicator that is called public information campaigns (H1). H1 has three different levels. Zero means that there is no Covid-19 public information campaign. However, two points indicate a well-organized public information campaign.
The last values of indicators with respect to countries are shown in Table 2.
TABLE 2. Indicator Scores in E7 Countries.
| Country | C1 | C2 | C3 | C4 | C5 | C6 | C7 | C8 | H1 |
|---|---|---|---|---|---|---|---|---|---|
| Brazil | 3 | 3 | 2 | 4 | 2 | 2 | 2 | 4 | 2 |
| China | 3 | 3 | 2 | 4 | 2 | 3 | 2 | 3 | 2 |
| India | 3 | 1 | 2 | 3 | 1 | 2 | 2 | 4 | 2 |
| Indonesia | 2 | 2 | 2 | 4 | 0 | 2 | 1 | 1 | 2 |
| Mexico | 3 | 2 | 2 | 3 | 1 | 2 | 2 | 3 | 2 |
| Russia | 2 | 2 | 2 | 4 | 1 | 2 | 2 | 4 | 2 |
| Turkey | 3 | 1 | 2 | 0 | 1 | 2 | 1 | 3 | 2 |
The models
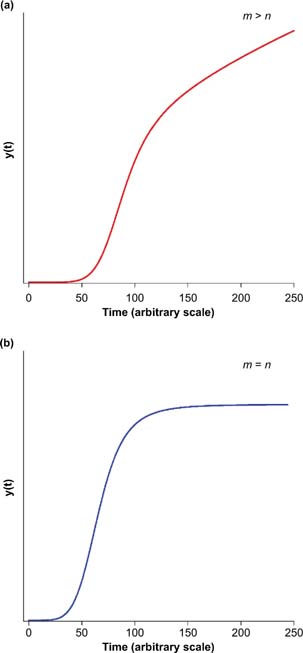
Number of cumulative cases of COVID-19 infection data versus time of some countries indicated sigmoid behavior, although for most of the countries this was not the case due to the high number of daily cases. The following can be a suitable model:
Where, y(t) is the number of cumulative cases and a, b, m, and n are the adjustable parameters. According to this model, when t = 0, y(t) = 0; that is, initially the number of cumulative cases is zero and note that if m > n, as t → ∞ y(t) → ∞ that is, the number of cumulative cases increases continuously. In the opposite case, if m < n, t → ∞ y(t) → 0. Therefore, the former was the suitable model for COVID-19 data.
Special case of the model where n = m is:
According to Eq. (2) when t = 0, y(t) = 0 and when t → ∞ y(t) → am i.e., number of cumulative cases converges to a certain value. The models were both proposed and used by Corradini and Peleg6 for microbial growth curves. Both models are demonstrated in Figure 1.
Red line in Figure 1(a) indicates Eq. (1) and blue line in Figure 1(b) indicates special case of Eq. (1) that is Eq. (2).
FIG 1. Demonstration of the models used to describe the number of cumulative COVID-19 cases, y(t).
The cumulative number of cases with respect to time were either described by Eq. (1) or Eq. (2). The date of the first case seen may differ from country to country and the first datum point (both time and case) was taken as zero to satisfy the initial condition that is, t = 0 y(t) = 0. Forecasting was done up to end of August, September, and October 2020 according to model parameters estimated.
Non-linear regression was performed by using SigmaPlot 12.0 (Chicago, IL, USA); models were assessed by using adjusted determination coefficient (R2adj) and standard error of the estimate (SE).
In the second part of this study, we aimed to examine the causalities between the Stringency Index’s indicators and total cases in E7 countries in COVID-19 period. Therefore, we proposed some policies to these countries to control their total cases. For this purpose, we used Granger Causality tests.
Granger7 develops a test technique for revealing causality in time series. We assumed that Xt and Yt are stationary series. With Granger Causality Tests, these series were examined for the causality relationship with the regression models in the system of equations given below Eq. (3) and Eq. (4).8
The main approach is that if past values of Xt are significant predictors of the current value of Yt when past values of Yt have been included in the model, then Xt presents a causal influence on .9
In our study, we examined all indicators of the Stringency Index and the number of total cases for each E7 member country to determine causalities between each indicator and the total number of cases in these countries. We presented the short-run relationship between these parameters by using F-tests. The short-run causality tests suggested that there is an evidence (or not) of direct causality between indicators and total number of cases in members. Therefore, we evaluated appropriate policies that could be used to control the total number of increasing cases in E7 countries. So, we focused on the causalities from indicators to the total number of cases given below Eq. (5).
Where TCt represents the total number of cases and is the indicator of the Stringency Index. The causalities between the indicators and the total number of cases were obtained by using E-views 10.
Results and Discussion
Figure 2 shows the COVID-19 infections together with the Stringency Index in Turkey. It was apparent that the full model, Eq. (1), produced a much better fit than the reduced model, Eq. (2). In fact, Eq. (2) underestimated the number of infections in Turkey. The data indicated that the cumulative number of infections is still increasing in Turkey; however, the rate is slower than that in the end of April or beginning of May 2020.
FIG 2. Fits of Eq. (1) (red lines) and Eq. (2) (blue lines) to COVID-19 cases in Turkey. Circles in Figure 2 indicate COVID-19 data and bars indicate the Stringency Index.

COVID-19 infection data in China are given in Figure 3. Unlike Turkey, data became stable in China meaning that the total number of daily infections are not high in number. Almost identical fits were observed for Eqs. (1) and (2) at the exponential phase. On the other hand, Eq. (1) slightly overestimated the infections whereas Eq. (2) slightly underestimated the infections especially for the last few data points at the stationary phase.
FIG 3. Fits of Eq. (1) (red lines) and Eq. (2) (blue lines) to COVID-19 cases in China. Circles in Figure 3 indicate COVID-19 data and bars indicate the Stringency Index.

The data for Brazil is shown in Figure 4. Brazil had a different pattern than that of Turkey and China viz., the number of cases or infections continue to increase. Therefore, both models, Eqs. (1) and (2), were used to describe the data. Although both models produced reasonable fits, it was not easy to predict the exact future pattern. It would be possible to see which models’ prediction is better for Brazil in the days to come. The other E7 countries that is, India, Indonesia, Mexico, and Russia had a similar pattern with that of Brazil — data not shown.
FIG 4. Fits of Eq. (1) (red lines) and Eq. (2) (blue lines) to COVID-19 cases in Brazil. Circles in Figure 4 indicate COVID-19 data and bars indicate the Stringency Index.

Forecasting was done till the end of August, September, and October 2020 and results are given in Table 1. As of July of 25, 2020, there have already been more than 220,000 infections in Turkey; however, Eq. (2) estimated the number of infected people as 219,212 by the end of August 2020 which was unrealistic. On the other hand, the total number of infections were estimated as 255,525, 280,686 and 303,440 by the end of August, September, and October, respectively by using Eq. (1) — see Figure 2 and Table A-1 (at Appendix). Very close estimates were obtained for China, India, and Indonesia by using both models while for Brazil, Mexico, and Russia predictions were quite different for both models.
Based on the data, E7 countries could be grouped as “stationary,” “transition,” and “exponential.” China is the sole stationary country and Turkey is the sole transition country. In China, as mentioned above, infection seemed to be under control. In Turkey, the spread of the infection was not as fast as before that is, it seemed to slow down. Nevertheless, the number of cumulative cases still increases and Eq. (1) can be used to describe such data. On the other hand, the number of cases continue to increase in a way that the spread of the disease is out of control for exponential countries (Brazil, India, Indonesia, Mexico, and Russia). Neither Eq. (1) nor Eq. (2) can be used to describe such data because the sigmoidal data were not observed but still forecasting was done with both models for these countries.
In the context of this study, the causalities were examined between the indicators of the Stringency Index and the total number of cases in E7 by using Eq. (5). According to our calculations, in China, a stationary country, all indicators presented a causal influence on total cases. Mexico followed China with six significant test results. Russia and India had four causalities whereas Indonesia had three short-run relationships between the indicators and the total number of cases. Turkey and Brazil had only two different indicators of influence over the total cases. The results are shown in Table A-2 (at Appendix).
In addition to these results, we showed appropriate indicators that can be used in E7 countries to control the total number of cases as a summary in Table 3. China can use all indicators to protect the total number of cases. As a stationary country, it will be a good option for the maintenance of these levels for all indicators to preserve the number of total cases. Turkey was the only transition country in E7 countries. Turkey should use C5 (public transport restrictions) and C6 (stay at home requirements) indicators, effectively. At least, Turkey needs to protect the current position for these indicators. According to the number of total cases, increasing the restrictions over the people’s mobility in Turkey should be a key factor to control the contagion of COVID-19.
TABLE 3. Summary of Indicators in E7 Countries.
| Country | C1 | C2 | C3 | C4 | C5 | C6 | C7 | C8 | H1 |
|---|---|---|---|---|---|---|---|---|---|
| Brazil | √ | √ | |||||||
| China | √ | √ | √ | √ | √ | √ | √ | √ | √ |
| India | √ | √ | √ | √ | |||||
| Indonesia | √ | √ | √ | ||||||
| Mexico | √ | √ | √ | √ | √ | √ | |||
| Russia | √ | √ | √ | √ | |||||
| Turkey | √ | √ |
Five of the E7 countries were found as exponential countries. Therefore, these countries need to apply policies that are determined causalities between the total cases more firmly than Turkey and China. Brazil applies C4 with the strictest level whereas this country can increase the level of stay at home requirements.
India can use C3, C4, C5, and C7 indicators to control the increasing number of cases. In India, public events are cancelled and internal movements are restricted. These policies can continue at these levels. However, private gatherings and public transport restrictions can be improved.
C2, C4, and C6 can influence the total number of cases in Indonesia. This country applies the highest level for restrictions on gatherings. This policy can be sustainable in the short term to control the total cases in this country. Meanwhile, the government encourages its citizens that work from their home and they can improve the restrictions for staying at home.
Mexico can use six different policies to control its exponential increase of the total cases. They may apply C3, C7, and H1 policies with the strictest level. They can protect these levels for those policies. However, restrictions on gatherings, restrictions on public transport, and leaving home conditions (except minimal exceptions) can be hardened by the government of Mexico.
C2, C4, C5, and C8 indicators can be applied in Russia to control the number of total cases. The Russian Government could apply C4 and C8 restrictions at the maximum levels. However, they can increase the restrictions of the workplace opening (except essential workplaces, e.g., bakery) and the prohibitions of public transport.
Conclusion
In our study, we forecast the total number of COVID-19 cases in E7 countries by using the suitable mathematical models. We also examine the relationship between the Stringency Index’s indicators and total cases in these countries. Therefore, we present appropriate policies that can be applied to control the number of the total cases in E7 countries.
Our article is limited by data analyzed and the methodology used. According to countries’ structures, applications of these policies can change. We propose these policies based on our findings and our forecasting in these countries.