INTRODUCTION
Breast cancer is a cancerous growth that targets breast tissue.1 Women continue to have a high mortality rate due to breast cancer. According to data from the WHO (World Health Organization), breast cancer is a disease with a worldwide mortality rate of 42.5% and an annual average of 9.3 deaths per 100 woman.2 Age, gender, race, family history, genetics, and personal behaviors such as smoking, consuming alcoholic drinks, and food can all contribute to the development of breast cancer.3 Breast cancer continues to be a significant health issue.4 Using Soft computing reasoning approaches,4–6 breast cancer can now be detected due to the rapid growth of modern technology. One of the reasoning approaches of Soft computing is data mining, which is employed in health-related research.7,8 Data mining is a method that identifies patterns with promise and utility for handling massive databases. In data mining, classification approaches, such as the C4.5 algorithm, Nave Bayes, Neural Network, and K-Nearest Neighbor, are frequently utilized by academics to solve difficulties.9–12 The classification technique is also one of the most extensively researched algorithms.13–16
During the past decade, numerous researchers have employed classification approaches to solving breast cancer cases.3 Research by Bahmani17 suggested a hybrid model for breast cancer prediction, in which Naïve Bayes Network, Radial Basis Function (RBF) Network, and K-means clustering are utilized. Breast Cancer Wisconsin is the name of the dataset utilized, which was obtained from the UCI data repository. The results demonstrate that the hybrid model provided achieves an accuracy of 99% and an average absolute error of 0.019, which is superior to previous models. The subsequent work by Wu & Hicks18 proposed a Machine Learning (ML) method for classifying breast cancer patients. The proposed models to be evaluated are Support Vector Machines (SVMs), K-NN, Naïve Bayes, and Decision Tree, which are trained to classify two forms of breast cancer using specified features at varying threshold levels (triple-negative and non-triple-negative). The dataset is derived from The Cancer Genome Atlas RNA-Sequence data from 110 triple negative and 992 non-triple negative breast cancer tumor samples to determine the characteristics (genes). The experimental results demonstrate that the SVM model classifies breast cancer into triple-negative and non-triple-negative breast cancers more reliably and with fewer misclassifications than the other three models. In addition, (2021)19 proposed a classification model for breast cancer detection by optimizing the Optimization-Based Feature Classification. The proposed model is a combination of the Whale Optimization Algorithm (WOA) model and the SVM model. Utilizing the Breast cancer dataset from the UCI repository, the dataset contains information about breast cancer. The results demonstrate that our system beats PSO-SVM and GA-SVM with a 98.82%higher accuracy (WOA-SVM). In addition, research was conducted20 on the categorization of breast cancer by comparing three methods: Naïve Bayes, Neural Network, and SVM. The dataset consists of 2,000 digital mammography pictures, with 70%training data and 30%testing data. During the feature extraction process, the Gray Level Co-occurrence Matrix (GLCM) approach is utilized to represent two dimensions of gray level variation in the image. SVM offered the most consistent results in properly identifying the breast as ‘Normal’ or ‘Cancer’, with an accuracy of 99.4% on the training dataset and 98.76% on the test dataset.
Based on these considerations, this work proposes a classification model with a forward selection strategy in the classification algorithm to raise the value of classification accuracy using the breast cancer dataset. This model will be compared to the categorization model’s standard version.
RESEARCH METHODOLOGY
In the research, the forward selection technique is applied to the C4.5 algorithm to improve classification accuracy, in this case with the aid of a dataset to evaluate the results of data analysis. Breast Cancer from the UCI Machine Learning Repository is the dataset utilized. This dataset is one of three domains made available by the Institute of Oncology that have been utilized regularly in classification research. There are 286 records in the dataset with 9 attributes and 1 class (label). The identity of the attribute is Class (no-recurrence-events, recurrence-events); age (10–19, 20–29, 30–39, 40–49, 50–59, 60–69, 70–79, 80–89, 90–99); menopause (lt40, ge40, premen); tumor-size (0–4, 5–9, 10–14, 15–19, 20–24, 25–29, 30–34, 35–39, 40–44, 45–49, 50–54, 55–59); inv-nodes (0–2, 3–5, 6–8, 9–11, 12–14, 15–17, 18–20, 21–23, 24–26, 27–29, 30–32, 33–35, 36–39); node-caps (yes, no); deg-malig (1, 2, 3); breast (left, right); breast-quad (left-up, left-low, right-up, right-low, central); and irradiated (yes, no). The method proposed in this study is to apply the forward selection technique in increasing the accuracy of the C4.5 algorithm. This research uses the Rapid Miner Studio 9.10 software in the process of conducting the analysis. The experimental stages in this research are:
-
Prepare a dataset for use in experiments conducted by UCI Machine Learning Repository (Breast Cancer).
-
Apply the forward approach to the Breast Cancer dataset by means of split data (Training 70% and Testing 30%). Then, record the outcomes of the validation, which yields measurable statistics such as the area under curve Area Under Curve (AUC) and Accuracy.
-
Test the forward technique with the Breast Cancer dataset by splicing the data (Training 80% and Testing 20%). Then, record the outcomes of the validation, which yields measurable statistics such as AUC and Accuracy.
-
Test the forward approach with the Breast Cancer dataset by executing split data (Training 90% and Testing 10%). Then, record the outcomes of the validation, which yields measurable statistics such as AUC and Accuracy.
-
Test C4.5 without the forward approach on the Breast Cancer dataset through split data (Training 70% and Testing 30%). Then, record the outcomes of the validation, which yields measurable statistics such as AUC and Accuracy.
-
Test using Naïve Bayes with the Breast Cancer dataset by performing split data (Training 70% and Testing 30%). Then, record the outcomes of the validation, which yields measurable statistics such as AUC and Accuracy.
-
Compare the top results for accuracy and retrieve the best findings.
-
Incorporate the most effective classification algorithm’s results.
The proposed algorithm for this study is shown in Figure 1:
FIG 1. The proposed model.

RESULTS AND DISCUSSION
Figures 2 and 3 shows how the Breast Cancer dataset was used to test the C4.5 methods with a forward selection technique in Rapidminer 9.10. Figure 2 shows the details of the overall model, which combines the C4.5 algorithm with the forward selection technique (C4.5 + FS) and the standard classification model (C4.5 and Naïve Bayes). The C4.5 + FS model chooses the most important attribute by using feature selection (weighted by information gain). The results of the selection move on to the Forward Selection stage, where the dataset is split into two parts: training and testing. 70:30, 80:20, and 90:10 are the ratios that are used to compare. Then, Figure 3 shows how the C4.5 + FS model and the standard classification model were checked to make sure they were right. The accuracy, error, recall precision, and F-measure values will be used. These values will be found by evaluating the confusion matrix and the AUC curve.
FIG 2. The proposed design utilizing RapidMiner.

FIG 3. Validation procedure for all models tested using RapidMiner.

For attribute selection using feature selection (weight by information gain), there are seven attributes that are selected or relevant to the classification results using Rapidminer 9.10, while three attributes are considered to have no effect or are irrelevant to the classification results, as shown in Table 1.
TABLE 1. Results of attribute selection.
| Attribute | Weight |
|---|---|
| Breast-quad | 1 |
| Age | 0 |
| Menopause | 1 |
| Tumor-Size | 1 |
| Inv-Nodes | 1 |
| Node-Caps | 0 |
| Deg-Malig | 1 |
| Breast | 1 |
| Irradiat | 0 |
In Table 1, it is shown that optimal prediction can be made using nine attributes selected via feature selection (weight by information gain). These findings will be analyzed to determine the accuracy of comparison between the C4.5 + FS model and other categorization models listed in Table 2.
TABLE 2. Comparison of accuracy.
| Parameter | Accuracy (%) |
|---|---|
| C4.5 + FS (Split Data 70:30) | 76.74 |
| C4.5 + FS (Split Data 80:20) | 78.95 |
| C4.5 + FS (Split Data 90:10) | 78.57 |
| C4.5 (Split Data 70:30) | 65.12 |
| Naïve Bayes (Split Data 70:30) | 69.77 |
Figure 2 depicts the percentage of accuracy achieved by each model. The experimental results demonstrate that the forward selection methodology utilizing the C4.5 method (C4.5 + FS) beats the traditional classification technique (C4.5 and Naïve Bayes). The Naïve Bayes approach has a maximum accuracy of 69.77%and the C4.5 method has a maximum accuracy of 65.12%. In comparison to the C4.5 + FS model, the average accuracy values increased by 12.97%and 8.32%, respectively. As depicted in Figure 4, the following graph compares the accuracy rates of all models where the C4.5 + FS model has an accuracy value greater than 75% for all dataset comparison ratios.
FIG 4. Comparative accuracy chart.

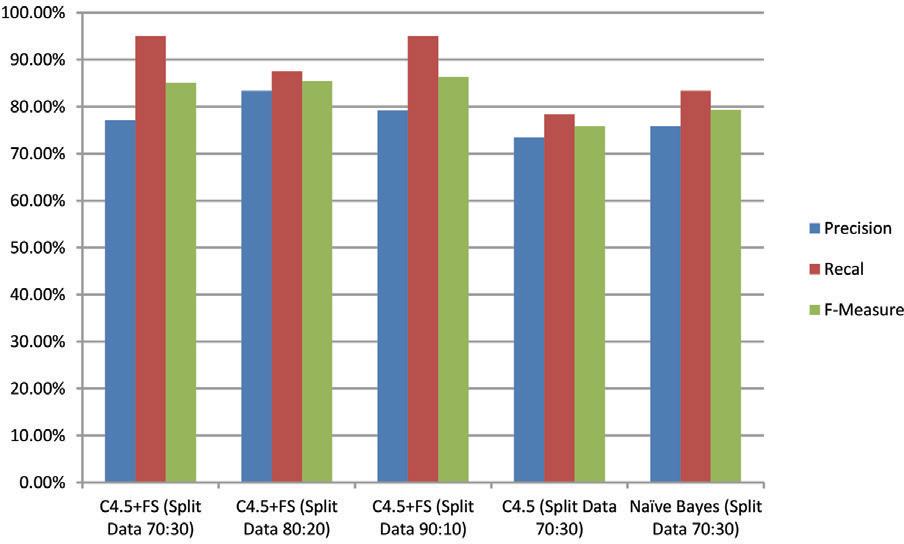
Table 3 displays the precision, recall, Recall, and F-measure percentages for each model employed. The precision of all C4.5 + FS models yields percentages of 77.03%, 83.33%, and 79.17%, respectively (an average of 79.17%). This result outperforms the Naïve Bayes and C4.5 models by 73.44% and 75.76%, respectively (better 4.08% and 6.40%).
TABLE 3. Comparative analysis of precision, recall, and F-measure.
| Parameter | Precision (%) | Recal (%) | F-Measure (%) |
|---|---|---|---|
| C4.5 + FS (Split Data 70:30) | 77.03 | 95 | 85.07 |
| C4.5 + FS (Split Data 80:20) | 83.33 | 87.50 | 85.37 |
| C4.5 + FS (Split Data 90:10) | 79.17 | 95 | 86.36 |
| C4.5 (Split Data 70:30) | 73.44 | 78.33 | 75.81 |
| Naïve Bayes (Split Data 70:30) | 75.76 | 83.33 | 79.37 |
Meanwhile, the recall and F-Measure percentages for all C4.5 + FS models are much better than the Naïve Bayes and C4.5 models. The average recall and f-measure percentages were 93 and 86% or better 14 and 9% of the Naïve Bayes model and C4.5 (recall) and 10 and 6% better than the Naïve Bayes model and C4.5 (f-measure). For clarity, the following chart compares all models based on the percentage of precision, recall, Recall, and F-measure as shown in Figure 5.
FIG 5. Comparison graph of all models’ precision, recall, and F-measure levels.
The receiver operating characteristics (ROC) curve is a technique or method that helps you see, organize, and choose the best classification model based on how well it works. ROC has an area called the AUC that is very useful for comparing the performance of different classification models to find out which one is the best.21 In Table 4, the levels of accuracy of the different classification models that were used to find the best classification method are compared. Compared to Naïve Bayes and C4.5, Model C4.5 + FS has the best AUC. In the fair classification category, the average AUC value is 0.763 when using the C4.5 + FS model. In the poor classification category, Naïve Bayes and C4.5 have AUCs of 0.653 and 0.628, respectively.
The following is a graph of the AUC of all models as shown in Figure 6.
TABLE 4. Comparative analysis of area under curve.
| Parameter | AUC |
|---|---|
| C4.5 + FS (Split Data 70:30) | 0.783 |
| C4.5 + FS (Split Data 80:20) | 0.732 |
| C4.5 + FS (Split Data 90:10) | 0.762 |
| C4.5 (Split Data 70:30) | 0.628 |
| Naïve Bayes (Split Data 70:30) | 0.653 |
AUC, Area Under Curve.
FIG 6. Comparison graph of all models’ models’ area under curve.

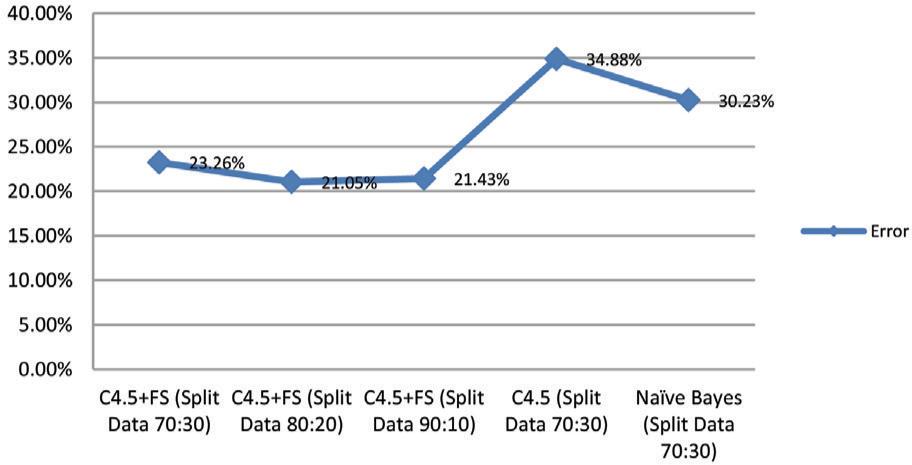
Table 5 shows how the errors of all the models that were tested with the Breast Cancer dataset are compare with each other. The rate of errors is lower when you use the C4.5 method with the forward selection technique (C4.5 + FS) than when you use the standard classification model. The standard classification model and C4.5 + FS are not the same in a big way. In Table 5 and Figure 7, the error values for each model are shown in the form of tables and graphs.
TABLE 5. Comparative analysis of error.
| Parameter | Error (%) |
|---|---|
| C4.5 + FS (Split Data 70:30) | 23.26 |
| C4.5 + FS (Split Data 80:20) | 21.05 |
| C4.5 + FS (Split Data 90:10) | 21.43 |
| C4.5 (Split Data 70:30) | 34.88 |
| Naïve Bayes (Split Data 70:30) | 30.23 |
FIG 7. Comparison graph of all models’ error.
CONCLUSION
Based on the results of this study’s experiments and evaluations, it can be concluded that the integration of the C4.5 algorithm with the forward selection technique (C4.5 + FS) for the Breast Cancer dataset increased accuracy by 12.97% and 8.32%, respectively, when using training data samples with a ratio of 70:30, 80:20, and 90:10. Compared to other standard classification algorithms (C4.5 and Naïve Bayes), the increase in accuracy value is significant. In terms of precision, recall, and F-measure, the forward selection strategy using the C4.5 method beat all other classification techniques, achieving 79.84%, 92.50%, and 85.55%, respectively. Thus, it can be stated that there is a considerable difference in precision between the C4.5 + FS approach with C4.5 and the Naïve Bayes method.